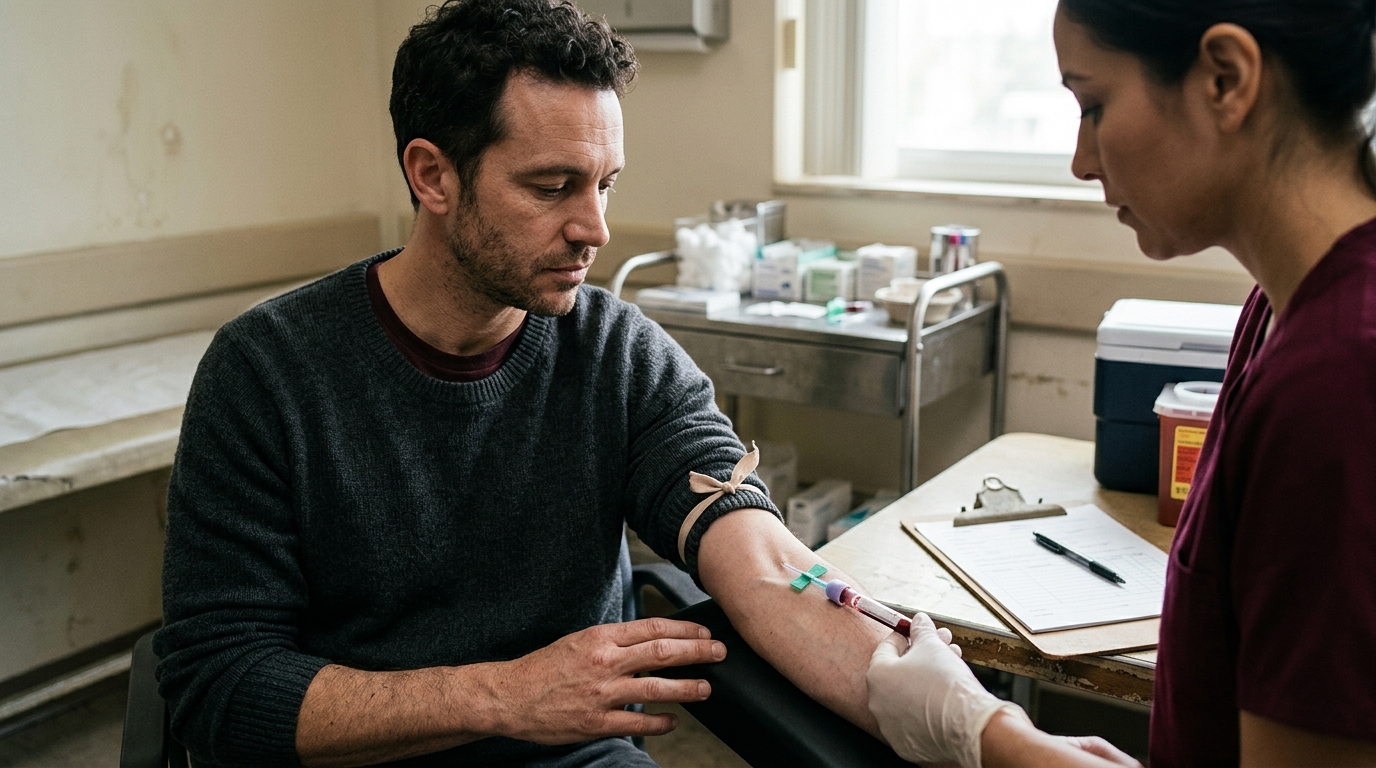

Blood test results showing low total testosterone in men with obesity often reflect reduced SHBG levels rather than true hormonal deficiency.





A low total testosterone reading on a standard laboratory report does not always mean a man produces insufficient androgen hormones. In men carrying excess body weight, total testosterone often drops significantly while the actual amount of active hormone remains completely normal. This apparent contradiction confuses many patients and can lead to inappropriate clinical decisions if blood work is read in isolation.
Understanding how body weight, liver function, and carrier proteins interact is essential for interpreting male hormone panels accurately. Total testosterone measures the entire pool of hormone circulating in the blood, but most of that hormone is bound to proteins and cannot readily enter tissues. When metabolic health changes, these carrier proteins change as well, altering total hormone numbers without necessarily changing the biological activity in the body.
This guide provides educational information about the biological relationships between body weight, sex hormone-binding globulin, and circulating testosterone. It is designed to help you understand your laboratory results and have more informed conversations with your doctor. This content is for educational purposes only and does not constitute personal medical advice, diagnosis, or treatment protocols.
Testosterone travels through the bloodstream attached to different carrier proteins. The two primary carrier proteins are sex hormone-binding globulin, known as SHBG, and albumin. Only a tiny fraction of testosterone circulates completely unbound. This unbound portion is called free testosterone.
SHBG is a specialized glycoprotein produced primarily by the liver. It binds testosterone with very high affinity, meaning it holds onto the hormone tightly. Around 40 to 70 percent of total circulating testosterone is typically bound to SHBG. Testosterone that is tightly bound to SHBG is generally considered unavailable for immediate tissue uptake.
Albumin is the most abundant protein in blood plasma. It also binds testosterone, but with much lower affinity than SHBG. Because this binding is weak, testosterone can detach from albumin relatively easily as blood flows through capillary beds. The combination of free testosterone and albumin-bound testosterone is commonly referred to as bioavailable testosterone.
Free testosterone makes up only about 1 to 3 percent of the total circulating testosterone pool in healthy adult men. Despite representing a small percentage, free testosterone is biologically critical because it can diffuse freely into cells and bind to androgen receptors. When clinicians evaluate hormone status, they must consider both the total amount of hormone present and how much of it is bound to these carrier proteins. You can learn more about specific laboratory assays through comprehensive hormone testing guides.
When SHBG concentrations in the blood fall, the total capacity of the blood to carry bound testosterone decreases. As a result, measured total testosterone drops. However, the regulatory systems in the body often keep the concentration of free, active testosterone stable. This creates a laboratory pattern where total testosterone looks low, but free testosterone remains well within the normal reference range.
In men with obesity, this binding-protein effect is one of the most common reasons for an unexpected lab result. Insulin resistance, which frequently accompanies excess body fat, directly influences how the liver produces SHBG. High circulating insulin levels signal hepatocytes in the liver to downregulate the production and release of SHBG into the bloodstream.
With less SHBG in circulation, total testosterone measurements fall in proportion to the reduction in binding sites. A clinician who looks only at the total testosterone number might suspect primary or secondary hypogonadism. However, measuring SHBG and determining free testosterone often reveals that the patient maintains adequate levels of unbound androgen.
The impact of body mass on male hormones exists along a spectrum. In overweight individuals or those with moderate obesity, the primary hormonal change is often limited to a reduction in SHBG. In these cases, the brain and the testes continue to communicate effectively, maintaining normal tissue exposure to active testosterone.
Cross-sectional research illustrates this group-level difference clearly. In studies comparing men with obesity to non-obese men of similar age, average SHBG was significantly lower in the obese group, measuring around 36 nmol/L compared to 50 nmol/L in non-obese controls. Total testosterone was similarly lower in the group with obesity, averaging 10.5 nmol/L compared to 14.1 nmol/L in the control group.
Despite these clear differences in total testosterone and binding proteins, calculated free testosterone remained virtually identical between the two groups. The hypothalamic-pituitary-testicular axis adjusted to the lower binding capacity while keeping active hormone levels stable. This state is sometimes referred to in medical literature as obesity-related pseudo-hypogonadism, because the low total number mimics true hormone deficiency without causing true cellular androgen depletion.
The biological picture often changes when obesity becomes severe. In men with a body mass index of 40 kg/m² or higher, hormonal changes frequently extend beyond a simple reduction in SHBG. In severe obesity, free testosterone concentrations often decline alongside total testosterone, accompanied by low or inappropriately normal gonadotropin levels.
When both total and free testosterone fall while luteinizing hormone remains un-elevated, it indicates central suppression of the hypothalamic-pituitary-testicular axis. In a healthy feedback system, the pituitary gland responds to falling testosterone by releasing more luteinizing hormone, known as LH. If LH does not rise when testosterone is low, the signal from the brain to the testes is suppressed.
Several biological factors contribute to central axis suppression in severe obesity:
These physiological factors show that severe obesity can impair actual hormone production rather than just altering carrier proteins. Distinguishing between an isolated SHBG drop and genuine central axis suppression requires a comprehensive clinical assessment, including measurement of gonadotropins, metabolic markers, and clinical symptoms.
Because total testosterone can be misleading when SHBG is abnormal, assessing free testosterone is essential in men with excess weight. There are two primary methods for determining free testosterone: direct laboratory measurement and mathematical calculation based on binding equations.
Direct laboratory measurement of free testosterone can be challenging. Many commercial laboratories use direct analog radioimmunoassays, which are widely recognized as inaccurate. Direct analog assays often produce unreliable results because the tracer molecule cross-reacts with bound hormone or fails to reflect true equilibrium conditions.
The gold standard for directly measuring free testosterone is equilibrium dialysis. In this laboratory method, serum is placed on one side of a semipermeable membrane that allows only unbound testosterone molecules to pass through. Once the system reaches equilibrium, the free hormone in the dialysate is measured using sensitive mass spectrometry. While highly accurate, equilibrium dialysis is technically demanding, expensive, and not offered by every diagnostic facility.
Because equilibrium dialysis is not universally available, major clinical guidelines support the use of calculated free testosterone. Calculated free testosterone uses well-established mathematical equations that model the law of mass action between testosterone, SHBG, and albumin. The most validated and widely used formula in clinical research is the Vermeulen formula.
To calculate free testosterone accurately, the laboratory or clinician requires three specific blood measurements from the same blood draw:
Calculated free testosterone provides a dependable estimate of active hormone in the vast majority of patients. When an individual has low total testosterone combined with low SHBG, calculating free testosterone helps determine whether the low total value is a harmless reflection of binding protein dynamics or an indicator of true androgen deficiency. Reviewing testosterone blood tests and biomarker panels can help you understand what each test measures.
It is important to remember that calculated values remain estimates. A calculated free testosterone value should never be interpreted as an absolute diagnostic truth in isolation. It must always be evaluated alongside the patient's physical symptoms, medical history, and overall clinical presentation.
Accurate hormone evaluation requires strict adherence to standardized testing protocols. Testosterone levels naturally fluctuate throughout the day, following a circadian rhythm. In healthy young and middle-aged men, circulating testosterone peaks in the early morning hours and declines gradually toward the evening.
Professional endocrine organizations emphasize that a single abnormal test result is never sufficient to establish a diagnosis. The Endocrine Society and the European Society of Endocrinology recommend confirming low testosterone with at least two separate morning blood samples taken on different days. Both samples should be drawn in a fasting state before 10:00 or 11:00 a.m.
Standardization matters because several transient factors can artificially suppress testosterone concentrations on any given day:
When an initial morning test reveals low total testosterone in an overweight man, the next step is not immediate treatment. The appropriate step is repeating the test under strictly controlled morning, fasting conditions. During this repeat evaluation, the clinician should also order SHBG, albumin, LH, and follicle-stimulating hormone.
Repeating the test ensures that the abnormal value is persistent rather than a temporary fluctuation caused by lifestyle or laboratory variation. If repeat testing confirms low total testosterone, analyzing SHBG and free testosterone will clarify whether binding proteins are the primary cause of the low reading.
When repeat testing confirms that testosterone is genuinely low, measuring gonadotropins is the next critical diagnostic step. Gonadotropins are pituitary signaling hormones that direct testicular function. The two primary gonadotropins are luteinizing hormone (LH) and follicle-stimulating hormone (FSH).
LH acts directly on the Leydig cells in the testes to stimulate testosterone synthesis. FSH acts primarily on the Sertoli cells to support sperm production. Evaluating LH and FSH allows clinicians to classify low testosterone into distinct pathophysiological categories.
In primary hypogonadism, the defect originates within the testes themselves. The testes cannot produce adequate testosterone despite receiving strong hormonal signals from the brain. Because the negative feedback loop is broken, the pituitary gland releases large amounts of LH and FSH into the blood. Elevated gonadotropins alongside low testosterone confirm primary testicular failure.
In secondary hypogonadism, the defect originates higher up, within the hypothalamus or pituitary gland. The testes are structurally capable of producing testosterone, but they do not receive the necessary hormonal stimulus. In this situation, LH and FSH are low or inappropriately within the normal reference range despite low circulating testosterone.
Obesity-associated hormone suppression falls under the broad category of secondary hypogonadism. When severe obesity suppresses the HPT axis, LH and FSH remain inappropriately normal or low. The pituitary gland fails to increase LH release to compensate for the falling androgen levels.
However, an inappropriately normal LH value in an obese man does not automatically prove that obesity is the sole cause of the suppression. Other central conditions can cause an identical laboratory pattern:
Clinicians must evaluate the entire medical history before attributing secondary hypogonadism entirely to excess body weight. If gonadotropins are markedly suppressed or if the patient reports severe headaches, visual field defects, or significant loss of secondary sexual characteristics, further medical investigation is necessary. Evaluating symptoms of low testosterone within a broader clinical context ensures that alternative underlying medical conditions are not overlooked.
Because obesity-related hormone changes are functionally linked to metabolic status, changing body composition can alter the biomarker pattern. When men with obesity reduce body weight and improve metabolic health, their hormone levels often shift in measurable ways.
Longitudinal evidence from the European Male Ageing Study, known as EMAS, provides clear insight into how weight changes influence male hormones over time. Researchers followed men over a 4.4-year period to observe how gaining or losing body weight affected total testosterone, SHBG, free testosterone, and LH.
The study revealed that the magnitude of weight loss determines which biomarkers change:
In men who lost a modest amount of weight (under 15 percent of their initial body mass), total testosterone increased by an average of approximately 2 nmol/L. However, calculated free testosterone showed no significant change. In this group, the rise in total testosterone tracked a corresponding increase in SHBG.
As insulin sensitivity improved with modest weight reduction, the liver produced more SHBG. The blood was able to bind and carry more total testosterone, raising the measured total number. However, the central reproductive axis did not significantly alter its baseline production of active, free hormone.
In men who achieved substantial weight loss of 15 percent or more of their body mass, the hormonal response was much broader. Total testosterone increased substantially, rising by an average of 5.75 nmol/L. Calculated free testosterone also rose significantly, increasing by an average of 51.78 pmol/L.
Furthermore, circulating LH levels increased by an average of 2 U/L in this group. This concurrent rise in free testosterone and LH demonstrates that substantial weight loss can help reactivate the central hypothalamic-pituitary-testicular axis. Reducing severe visceral adiposity relieved the central suppression, allowing the brain to send stronger pulsatile signals to the testes.
Meta-analyses examining dietary and surgical weight-loss interventions reflect these findings across different populations. On average, diet and lifestyle interventions in clinical trials produce an average total testosterone increase of 2.87 nmol/L, reflecting typical modest weight reductions. Bariatric surgery, which produces much larger reductions in body mass, results in an average total testosterone increase of 8.73 nmol/L alongside significant increases in free testosterone.
In men with obesity and uncontrolled type 2 diabetes, losing more than 10 percent of body weight has been associated with significant improvements in both total and free testosterone. Many men in these cohorts crossed back into the normal clinical reference range without exogenous hormone therapy. These findings underscore the direct link between lifestyle factors and metabolic health and male endocrine function.
These study results represent group-level statistical averages, not guaranteed personal outcomes. An individual's hormonal response to weight loss depends on age, baseline testicular health, the duration of obesity, and concurrent medical conditions. Weight reduction is a foundational health measure, but its impact on hormone numbers varies from person to person.
When evaluating information about obesity, SHBG, and testosterone, it is important to distinguish between established clinical guidelines and observational research. Clinical guidelines represent consensus recommendations developed by expert panels after reviewing large bodies of clinical trial data. Observational studies describe statistical associations within specific groups of people.
Major endocrine societies have published clear guidance regarding how to evaluate testosterone in men with obesity:
Observational studies, such as the EMAS cohort, provide valuable data regarding how hormones behave across populations over time. However, observational research cannot establish direct cause-and-effect relationships for an individual patient. A statistical association observed across hundreds of men cannot predict with absolute certainty how one specific person will respond.
Similarly, proposed biological mechanisms, such as adipose aromatization or cytokine suppression, are helpful scientific models. They explain how excess weight can alter endocrine pathways. However, a scientific model should not be mistaken for an individual diagnosis. Every patient presents a unique combination of genetics, metabolic health, lifestyle factors, and hormone levels that must be evaluated holistically.
Reviewing common biomarker patterns helps illustrate how these physiological concepts appear on actual laboratory reports. The following scenarios represent educational models of common clinical presentations, not diagnostic templates.
A 44-year-old man with a body mass index of 32 kg/m² undergoes routine laboratory testing. His morning total testosterone returns at 260 ng/dL (reference range: 300 to 1,000 ng/dL), which is flagged as low. His SHBG level is measured at 14 nmol/L (reference range: 15 to 50 nmol/L).
A calculated free testosterone test reveals a value of 7.2 ng/dL (reference range: 5.0 to 21.0 ng/dL), which is comfortably within normal limits. His LH and FSH levels are normal.
Interpretation: This pattern illustrates the classic binding-protein effect. The patient's low total testosterone reading is primarily driven by reduced circulating SHBG, likely related to mild insulin resistance. Because his calculated free testosterone and gonadotropins are normal, his tissues are receiving adequate active androgen. His low total testosterone alone does not establish testosterone deficiency.
A 52-year-old man with a body mass index of 42 kg/m² presents with persistent low energy, reduced muscle mass, and metabolic syndrome. Two separate morning fasting blood tests confirm a total testosterone of 180 ng/dL. His SHBG is low at 12 nmol/L.
His calculated free testosterone is 3.1 ng/dL, which is unequivocally below the normal reference range. His serum LH is 2.4 IU/L, which is in the lower half of the normal range.
Interpretation: This pattern illustrates functional secondary axis suppression in the setting of severe obesity. The patient has low total testosterone and genuinely low free testosterone. His LH level is inappropriately low given his suppressed testosterone, indicating that the pituitary gland is not responding normally to falling androgen levels. Further medical evaluation is warranted to assess metabolic factors, screen for sleep apnea, and rule out other central pituitary disorders.
A 38-year-old man with a baseline BMI of 33 kg/m² loses 7 percent of his body weight through dietary changes and regular exercise over six months. At baseline, his total testosterone was 280 ng/dL, his SHBG was 16 nmol/L, and his free testosterone was 6.8 ng/dL.
On follow-up testing, his total testosterone has risen to 350 ng/dL. His SHBG has increased to 24 nmol/L, while his free testosterone remains stable at 7.0 ng/dL.
Interpretation: This pattern mirrors the longitudinal findings from the European Male Ageing Study for modest weight loss. As the patient improved his metabolic health, his hepatic SHBG synthesis increased. The expanded SHBG pool carried more bound hormone, raising his measured total testosterone. His active free hormone remained stable, demonstrating that total testosterone can improve without a major change in baseline glandular production.
A 48-year-old man with a baseline BMI of 41 kg/m² loses 18 percent of his body weight over 14 months following intensive medical lifestyle intervention. At baseline, he presented with a total testosterone of 190 ng/dL, free testosterone of 3.4 ng/dL, and an LH of 1.8 IU/L.
On repeat evaluation under standardized conditions, his total testosterone is 440 ng/dL, his free testosterone is 8.5 ng/dL, and his LH has risen to 4.2 IU/L.
Interpretation: This pattern illustrates central axis recovery following substantial weight reduction. Relieving severe visceral adiposity and systemic metabolic stress allowed his hypothalamic-pituitary-testicular axis to regain normal pulsatility. The rising LH stimulated his Leydig cells, leading to meaningful increases in both total and active free testosterone.
Interpreting hormone tests requires careful collaboration with a qualified healthcare provider. If you are reviewing laboratory results that show low total testosterone or altered SHBG, approaching your consultation with focused, constructive questions will help you get the most value from your visit.
Consider discussing the following points with your doctor:
Using these questions as a starting point allows you and your clinician to examine your health comprehensively. Rather than focusing solely on an isolated laboratory number, you can work together to address the underlying physiological factors that support long-term metabolic and hormonal well-being.
Understanding the complex interactions between body weight, carrier proteins, and reproductive signaling ensures that hormone panels are interpreted with clinical accuracy and appropriate context.
Testostra explains testosterone biology, testing, symptoms, lifestyle factors and TRT with careful sourcing and clear clinical limits.



Send us a question, research idea or topic suggestion. Reader questions help shape future Testostra content.
Contact Testostra